The Index at a glance
Two readings per district — asking rent and asking price — plus a third, the Rent Gap, that the companion index will fill. Patisia shown as the worked example.
5.0–6.7%
4.5–4.9%
4.0–4.4%
3.3–3.9%
Key findings
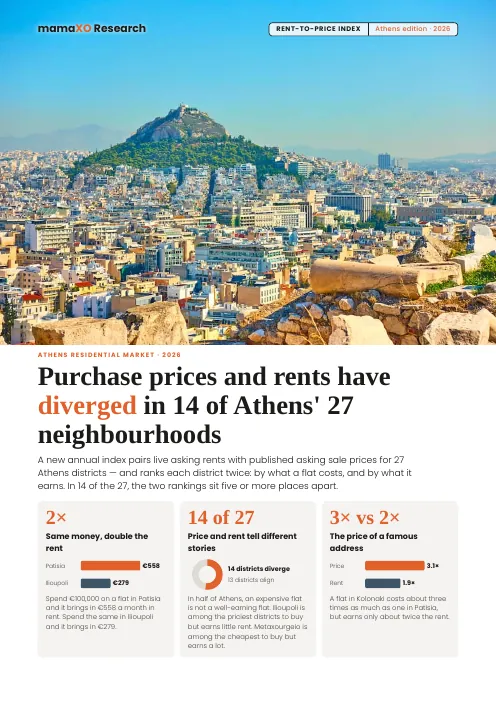
Athens is one of Europe's most discussed property markets, yet nobody publishes rent against price for the whole city at neighbourhood level. This index does, district by district. In Athens, the highest rents and the highest prices no longer share the same postcode — and the map contradicts the instinct that the prime coast is where a flat earns its keep.
The Athens market in 2026
The yield picture sits on a market that is still rising but maturing, with stretched affordability and steady international demand — the conditions that make neighbourhood selection decisive.
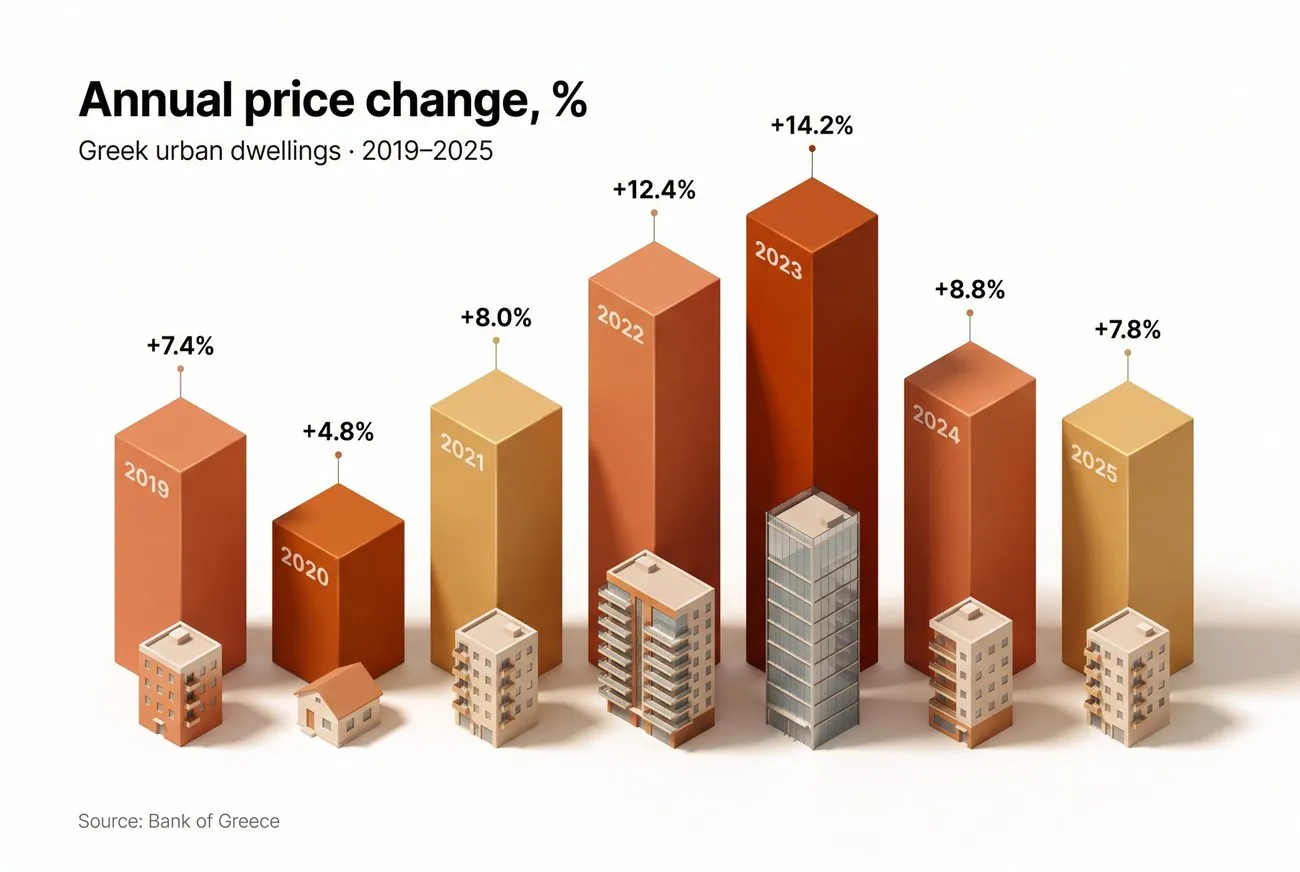
Bank of Greece data show apartment prices still climbing — up 5.2% year-on-year in Athens in the first quarter of 2026 — while national prices have moved past their 2008 peak in nominal terms. Affordability has stretched: the IMF finds Greek house prices up roughly 85% since 2017 against incomes up only 47%. With ownership out of reach for many households, rental demand is firm, and international investors continue to buy. In that environment the gap between the highest- and lowest-earning neighbourhoods is not a rounding error; it is one of the largest levers visible in this dataset.
Why the rent holds
A high yield only matters if the rent behind it is durable. Five forces underpin rental demand in Athens, and several bear hardest on the central districts the index highlights.
Supply lagged for a decade — and is now turning. Residential completions ran well below the previous decade's pace and the lettable pool stayed tight through 2024; in early 2026 construction rebounded, with permits and volumes up by double digits year-on-year (ELSTAT). Tight new supply is easing rather than the durable prop it once was. Much of the real constraint is quality: a large vacant stock that is older and not rental-ready.
Several demand pressures remain strong. Greece drew a record 37.98 million non-cruise arrivals in 2025, and short-term-rental pressure on central housing — Attica carried nearly 60,000 short-term listings in 2024 — was strong enough that the government froze new registrations in Athens' three central districts through 2026, pushing stock back toward long lets. Stretched affordability keeps ownership out of reach for many households. Tourism shapes the market, but its specific contribution to long-term rents is not measured here.
Transport and universities sit beside the high-yield belt. Metro Line 4 (Section A, 15 stations, under construction) will place a station in six of the 27 districts — Galatsi, Kypseli, Exarchia, Kolonaki, Ilisia and Zografou. Those six average 4.7% gross against 4.3% for the other 21: a contextual overlap, not a demonstrated cause. Two of the city's largest universities anchor campuses in Zografou and on Patission Avenue, beside several of the affordable central districts.
Rental yield across Athens
Gross asking yield, district by district, arranged by rough geography. Warmer cells earn more per euro; the pattern — a hot central core cooling toward the northern suburbs and the coast — is visible at a glance.
Ranked by neighbourhood
The same yields as a league table. Ranked from highest to lowest, the central belt's lead — and the premium suburbs' shortfall — is impossible to miss.
Read the ranking as bands, not a strict ladder. These are asking-based medians, so small differences — particularly within the tightly grouped 4.0–4.2% cluster — should not be read as a firm ordering. Sample depth also varies by district; the confidence tier in §07 says which figures carry the widest uncertainty.
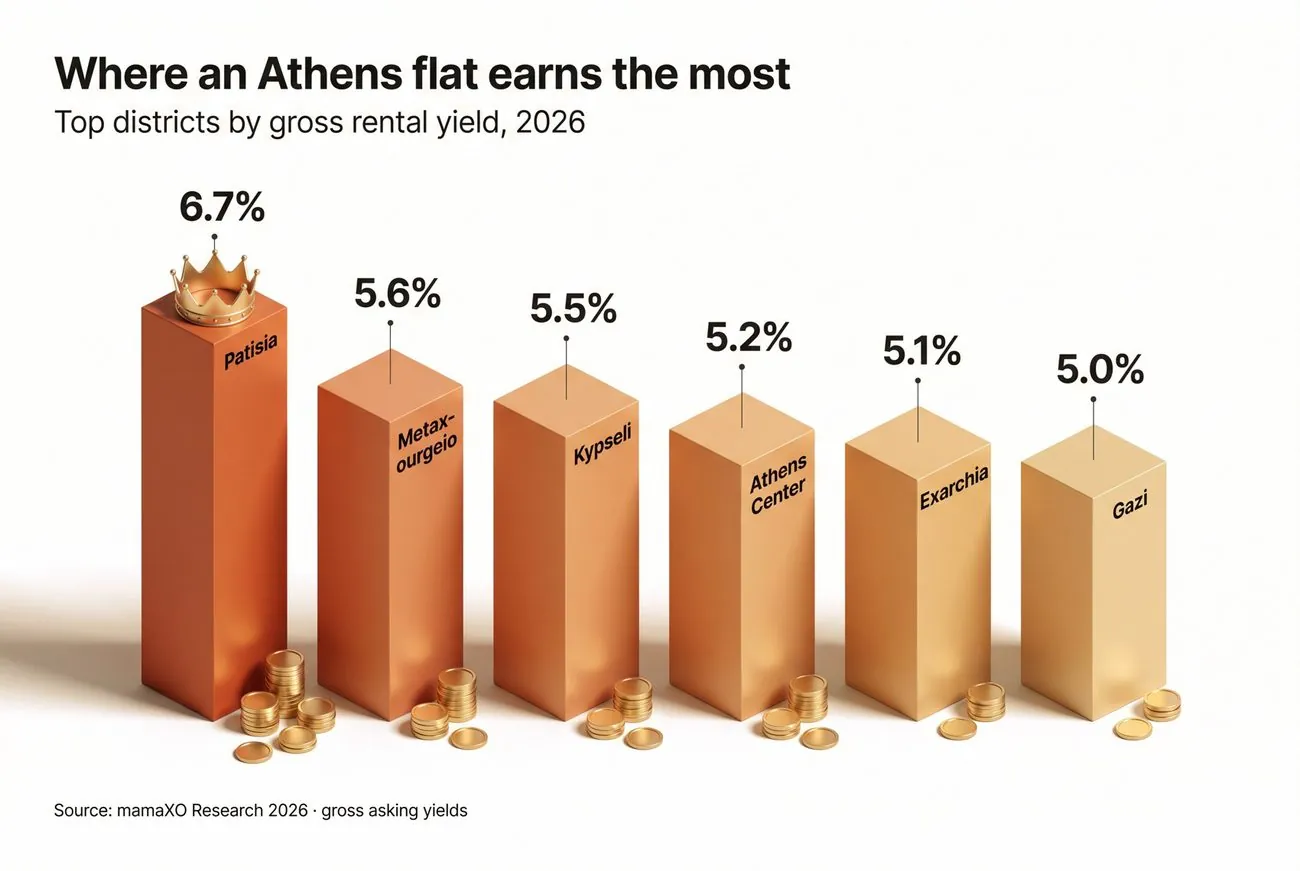
Patisia, Metaxourgeio, Kypseli, Athens Center, Exarchia, Gazi
Aigaleo, Ampelokipoi, Ilisia, Zografou
Vyronas, Koukaki, Galatsi, Neos Kosmos, Piraeus, Peristeri, Pangrati, Glyfada, Kifisia, Kolonaki
Kallithea, Nea Smyrni, Chalandri, Palaio Faliro, Nea Ionia, Marousi, Ilioupoli
Full results — 27 neighbourhoods
| Neighbourhood | Rent €/m²·mo | Sale €/m² | Gross yield | Rent / €100k | Payback, yrs | Sample |
|---|---|---|---|---|---|---|
| Patisia | 9.6 | 1,719 | 6.7% | €558 | 15 | ● adequate |
| Metaxourgeio | 11.3 | 2,424 | 5.6% | €466 | 18 | ● adequate |
| Kypseli | 10.0 | 2,170 | 5.5% | €461 | 18 | ● deep |
| Athens Center | 14.8 | 3,398 | 5.2% | €436 | 19 | ● thin |
| Exarchia | 12.3 | 2,906 | 5.1% | €423 | 20 | ● deep |
| Gazi | 14.1 | 3,416 | 5.0% | €413 | 20 | ● adequate |
| Aigaleo | 10.6 | 2,573 | 4.9% | €412 | 20 | ● adequate |
| Ampelokipoi | 12.3 | 3,071 | 4.8% | €401 | 21 | ● deep |
| Ilisia | 12.8 | 3,260 | 4.7% | €393 | 21 | ● adequate |
| Zografou | 11.1 | 2,839 | 4.7% | €391 | 21 | ● deep |
| Vyronas | 10.2 | 2,884 | 4.2% | €354 | 24 | ● thin |
| Koukaki | 13.4 | 3,826 | 4.2% | €350 | 24 | ● adequate |
| Galatsi | 9.6 | 2,744 | 4.2% | €350 | 24 | ● adequate |
| Neos Kosmos | 11.0 | 3,151 | 4.2% | €349 | 24 | ● adequate |
| Piraeus | 11.0 | 3,154 | 4.2% | €349 | 24 | ● deep |
| Peristeri | 9.2 | 2,641 | 4.2% | €348 | 24 | ● thin |
| Pangrati | 12.1 | 3,483 | 4.2% | €347 | 24 | ● deep |
| Glyfada | 19.0 | 5,669 | 4.0% | €335 | 25 | ● thin |
| Kifisia | 13.8 | 4,124 | 4.0% | €335 | 25 | ● thin |
| Kolonaki | 17.9 | 5,391 | 4.0% | €332 | 25 | ● adequate |
| Kallithea | 10.6 | 3,253 | 3.9% | €326 | 26 | ● adequate |
| Nea Smyrni | 10.7 | 3,332 | 3.9% | €321 | 26 | ● adequate |
| Chalandri | 12.2 | 3,882 | 3.8% | €314 | 27 | ● thin |
| Palaio Faliro | 12.4 | 4,016 | 3.7% | €309 | 27 | ● adequate |
| Nea Ionia | 9.7 | 3,217 | 3.6% | €302 | 28 | ● thin |
| Marousi | 11.9 | 4,001 | 3.6% | €297 | 28 | ● thin |
| Ilioupoli | 10.3 | 3,695 | 3.3% | €279 | 30 | ● thin |
Gross yield = median asking rent €/m² × 12 ÷ asking sale price €/m². Rent per €100k = the monthly rent a €100,000 purchase at the district's median price and rent would produce; payback = years of gross rent to repay the purchase price. Rents are from market live listings and mamaXO's own data set (Jul 2026), with one exception: Athens Center uses the Indomio broad-central median rent paired with its Indomio price. Sale prices: Indomio for inner-Athens districts (May–Jun 2026); xe.gr for suburbs (Q1 2026, ≤80 m²); Spitogatos for Glyfada (Q2 2026). Petralona omitted for lack of a matched rent/price pair.
Sample tiers. ● deep — the district median rests on a large retained listing sample; ● adequate; ● thin — treat the figure as indicative and the district's position within its band as uncertain. Tier thresholds are fixed in the standing rules (§16) and applied identically in every edition.
Yield falls as price rises
Grouping every district by purchase price shows the pattern: the cheaper the tier, the higher the average gross yield. Across all 27 the link is real and statistically significant — but moderate. A strong tendency, not a mechanical rule.
On the correlation. The three figures measure one relationship three ways: its direction and strength (−0.66), how much of the variation price explains (R²), and how unlikely the pattern is to be chance (p). Yield is rent divided by price, so some inverse relationship is expected by construction; the figures describe the observed pattern, not an independent causal mechanism. The affordable tier out-yields the premium tier by about 1.1 percentage points, roughly 29% more income per euro on a gross, asking basis, before costs.
Where price and rent disagree
Line up the 27 districts twice — once from most to least expensive to buy, once from highest to lowest rent. In a market that priced flats purely on the rent they earn, every district would sit in the same place on both lists. In 14 of 27 they sit five or more places apart. That is the finding of this edition: not that cheap areas yield more, but that in half of Athens the price of a flat and the rent it commands have diverged.
Price has run ahead of rent
Rent has run ahead of price
Wording rule. "Price has run ahead of rent," never "overpriced": this is a description of one snapshot, not a forecast that gaps close. Ranks use the competition method (ties share the higher rank). Ilioupoli and Metaxourgeio are the two extremes — 13 and 11 places — and both rest on the same asking-based inputs as the rest of the index.
District profiles
The numbers become clearer alongside the stories behind them. Ten neighbourhoods — from the highest-earning central belt to the prestige addresses at the other end — show why the ranking falls the way it does.
A working-class, densely multicultural district on the northern edge of the centre with some of the lowest prices per m² in the study — and a mixed reputation that can lengthen time-to-let and shape tenant demand. The high headline yield reflects cheap stock, not an effortless let; for a buyer it rewards local knowledge.
An edgy, artist-driven district beside the centre, long tipped as the 'next Psyri'. The largest rent-ahead-of-price gap in the index: third cheapest to buy, mid-table for rent.
Dense, multicultural and rapidly regenerating, known for its covered market and inter-war apartment blocks. One of Athens' defining gentrification stories and the deepest sample in the index.
The broad central district — Syntagma, Omonoia and the streets around them — rather than the prime historic core. Rents are solid; purchase prices sit well below the historic centre and the northern suburbs. Thin sample; read within its band.
Historically bohemian and ringed by the Polytechnic and university faculties, giving it deep, year-round student demand. A Metro Line 4 station is under construction.
The former industrial quarter around Kerameikos and the Technopolis, now one of Athens' liveliest nightlife districts. Rents are strong, but sale prices have risen into the mid-range for the centre, so the yield now sits mid-table rather than at the top.
The city's most prestigious central address. Rents are among the highest anywhere, but equally high purchase prices compress the yield — prestige and income rarely coincide.
The flagship of the Athens Riviera: a premium coastal lifestyle market with strong rents but purchase prices at the very top of the study. More consistent with an appreciation-and-lifestyle thesis than an income one.
A settled, sought-after northern suburb and business hub. Solid rents on high purchase prices — the mirror image of the affordable centre.
A comfortable, family-oriented southern suburb below Mount Hymettus. Steady rents but the study's tightest yield and its widest price-ahead-of-rent gap: prices reflect quality-of-life demand more than rental economics.
Yields as calculated in this study (gross, asking-based). Neighbourhood characterisations are qualitative context, not investment advice.
How the findings sit against other data
Two levels of check: were the portal inputs carried across correctly, and do the findings agree with sources outside the calculation?
The inner-Athens sale prices come from Indomio's published district figures (May–June 2026) and the suburban ones from xe.gr (Q1 2026); most match the source to the euro. This confirms the inputs were carried across faithfully — a consistency check on inputs, not an independent price. The rents come from market live listings and mamaXO's own data set.
The index rents — collected separately from the price feeds — track Spitogatos's published zone rents (North Athens ~€11.4/m² vs €11.5/m²). The Global Property Guide places Athens at about 5.5% gross and Greece at 4.38%; independent neighbourhood surveys put Patisia and Kypseli at the top of the Athens table, the same broad pattern as this index, with mamaXO's absolute yields at or below those peers.
Where sources differ. Investment-migration analysis (IMI Daily) lists Piraeus among the central districts with strong yields; this index places Piraeus mid-table at 4.2%. The difference reflects zone definitions and reference periods, and is the kind of disagreement a per-district price-source table (planned for the next edition) is meant to resolve. We report it rather than smooth it.
This is external corroboration and benchmarking — not an independent re-computation — and implies no partnership or endorsement by the named organisations. Full source URLs are in §17.
Is the yield attractive?
A 4–6% figure means little without a yardstick. Set against the returns a Greek investor can otherwise reach — and against other European markets — the central belt stands out.
Athens' central belt — Patisia, Metaxourgeio, Kypseli and Exarchia, averaging about 5.7% gross — yields well above the Greek 10-year government bond (about 3.8%) and roughly 5 times a one-year household time deposit (about 1.1%). It clears the national averages of Germany, Portugal and Greece as a whole; only Spain scores higher among the markets shown. Property income is not risk-free, but as a headline income benchmark the central districts screen well on a gross basis.
Comparability note. The Athens figures are gross rental yields — before vacancy, management, tax, maintenance and transaction costs; the bond and deposit yields are effectively net. Read the gap as directional, not a net-return comparison. A net-of-costs view is planned for a future edition.
Trends & challenges
Five forces shape how these yields are earned — and what an investor should weigh before acting.
What it means for investors
For anyone weighing an Athens rental purchase, location is not a matter of prestige alone — it is the dominant driver of income return. The market's two instincts pull in opposite directions: the smart-money reflex points to the prime coast, while the income-maximising choice sits in the affordable, regenerating centre.
The Rent Gap Index — measurement in progress
Every yield figure in this report, and in every other Athens index, is built on asking rents. Asking is not signed. mamaXO manages hundreds of rentals, and growing fast, for Greek and international owners — so it sees what tenants actually sign, how long a flat waits and what closes the deal. That knowledge becomes the Rent Gap Index: how far below the advertised rent tenants really sign, district by district — unique information for home owners and investors.
For each unit: the first asking rent at listing, the contract rent at signing, days from listing to signature, and any concession (free weeks, reduced deposit, included charges). Aggregated to the four yield bands first, then to districts once each clears the minimum cell size.
mamaXO's own listing-to-lease records, widened by partner agencies contributing anonymised signings under a shared method, in exchange for named co-credit on the index. Aggregate only; no individual contract is ever published.
Collection began with this edition. A first reading at band level is targeted for 2027; district-level readings follow as samples allow. Both indices are published once a year.
Standing rules of the index
These rules are fixed so that every edition is comparable to this one. Additions are allowed; redefinitions are not.
Known limitations. Yields pair the median asking rent with the median asking sale price per district; a ratio of medians is not identical to the median yield of individual properties, and the rent and sale cohorts are not size-, age- or condition-matched. Asking sale prices typically exceed achieved transaction prices, which may bias the denominator upward; asking rents may differ from contracted rents, so the net direction of bias cannot be established without achieved data — which is the point of §15. The price–yield statistics in §08 are Pearson r (two-tailed p) and Spearman rank correlation on unrounded yields, with R² = r². Thin-tier districts carry wider uncertainty than a single reported figure implies.
Data sources & notes
- Rent data set — market live listings and mamaXO's own data (this study's primary rent source) — median asking long-term rent by Athens neighbourhood, compiled July 2026
https://mamaxo.com - Indomio — published asking sale prices by Athens district and sub-district, May–June 2026
https://www.indomio.gr/ - xe.gr — Real Estate Market Trends — asking sale prices by area and size band (≤80 m²), Q1 2026
https://www.xe.gr/en/property/real-estate-market-trends-in-greece - Spitogatos — Property Index — published asking sale & rental prices by area and zone
https://www.spitogatos.gr/en/property-index - Bank of Greece — Residential Property Price Index — Q1 2026 (Athens +5.2% year-on-year); annual urban dwelling price changes 2019–2025
https://www.bankofgreece.gr/en/statistics/real-estate-market - Bank of Greece — inbound travel 2025 — 37.98m non-cruise arrivals (+5.6%)
https://www.bankofgreece.gr/en/statistics/external-sector/balance-of-payments - International Monetary Fund — Greek house prices vs incomes since 2017
https://www.imf.org/en/Countries/GRC - Hellenic Statistical Authority (ELSTAT) — building-permit statistics 2024 through Q1 2026; 2021 Census vacant dwellings (Municipality of Athens 117,137 / 26.8%)
https://www.statistics.gr - Greek Ministry of Migration & Asylum — residence-by-investment applications and backlog, 2024–2025
https://migration.gov.gr/en/ - Global Property Guide — Greece — independent Athens price and gross-yield benchmarks; European national yields 2025–26
https://www.globalpropertyguide.com/europe/greece/price-history - IMI Daily (Investment Migration Insider) — rental-yield analysis by district, 2026 (independent corroboration)
https://www.imidaily.com/ - Trading Economics / Bank of Greece — Greek 10-year government bond yield (~3.8%) and one-year household time-deposit rate (~1.1%), Jul 2026
https://tradingeconomics.com/greece/government-bond-yield - STASY / Elliniko Metro — Athens Metro Line 4, Section A — 15 stations, 12.8 km; official target completion end-2029
https://www.stasy.gr/en/company/future-projects/ - University enrolment (NKUA; NTUA) — NKUA 68,000+ students; NTUA ~10,000; campuses in Zografou and on Patission Avenue
https://en.uoa.gr/students - Numbeo — central purchase prices, European capitals, 2025 (context only)
https://www.numbeo.com/property-investment/
Gross rental yield = median asking rent × 12 ÷ asking sale price per m². Figures are asking-based and represent gross yield; three sale-price sources with differing methods mean the broad high-to-low pattern is consistent while exact ordering among closely grouped districts is indicative. Compiled July 2026. Government and statutory sources are cited in preference to private commentary. This report is provided for information only and does not constitute investment advice.